SELinux AVC activity ⚠
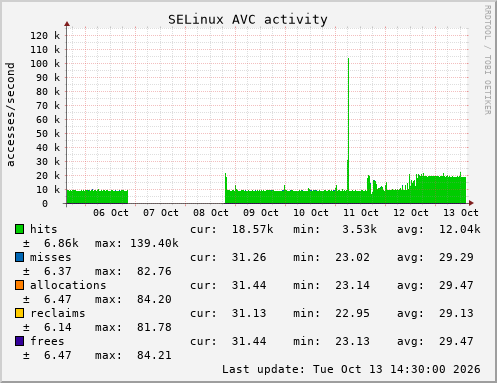
Access Vector Cache lookup activity, from /sys/fs/selinux/avc/cache_stats, summed across every possible CPU. hits + misses is the total lookup rate: no `lookups` field is stored, and no graph_total either, since allocations/reclaims/frees on this same graph aren't part of that sum. These are per-boot cumulative counters: a policy reload flushes cached entries but never resets these tallies.
last poll ago

 expected range — expected-range bands are not available on stacked graphs
trend — trend lines are not available on stacked graphs
expected range — expected-range bands are not available on stacked graphs
trend — trend lines are not available on stacked graphs
 expected range — expected-range bands are not available on stacked graphs
trend — trend lines are not available on stacked graphs
expected range — expected-range bands are not available on stacked graphs
trend — trend lines are not available on stacked graphs

 expected range — expected-range bands are not available on stacked graphs
trend — trend lines are not available on stacked graphs
expected range — expected-range bands are not available on stacked graphs
trend — trend lines are not available on stacked graphs

 expected range — expected-range bands are not available on stacked graphs
trend — trend lines are not available on stacked graphs
expected range — expected-range bands are not available on stacked graphs
trend — trend lines are not available on stacked graphs
| field — the plugin's label for the field, or its name where it gave none; the swatch is the colour the graph drew it with | cur — the newest consolidated value in the day window (30 h) | min — lowest value over the day window (30 h) — where the window is served by a coarser archive this is the true minimum, read from the RRD's own MIN archive rather than taken from the averaged rows; a field with a cdef stays on those averaged rows, since the minimum of a difference is not the difference of the minima | avg — mean of the consolidated values over the day window (30 h) | med — median of the consolidated values over the day window (30 h) — always an actual sample (the upper middle on even counts, never an interpolated value); beside avg so skew is visible at a glance | max — highest value over the day window (30 h) — where the window is served by a coarser archive this is the true maximum, read from the RRD's own MAX archive rather than taken from the averaged rows, so a spike inside one consolidated bin still shows; a field with a cdef stays on those averaged rows, since the maximum of a difference is not the difference of the maxima | σ — population standard deviation of the consolidated values over the day window (30 h) — an approximation over consolidated rows on long windows, unlike min and max, which read the RRD's own MIN/MAX archives there (except on a field with a cdef) | p5…p95 — 5th and 95th percentiles (linear interpolation) of the consolidated values over the day window (30 h) — the robust floor and ceiling beside min's and max's literal ones, for the fields where one unlucky bin is not the story; sort by either half. An approximation over consolidated rows on long windows, unlike min and max, which read the RRD's own MIN/MAX archives there (except on a field with a cdef) | p25…p75 — 25th and 75th percentiles of the consolidated values over the day window (30 h) — the box around med: half the window's samples lie between them, so the spread they show is one no single excursion can move, where σ beside them is a squared distance that skew drags around | Δ — this window's average against the preceding equal window's, as a signed percentage; consolidation may differ between the two windows on fine-rung boundaries, and a cell whose two windows came back at different resolutions says so on hover; '-' when the previous window offers no baseline — hover for why | trend (per hour) — least-squares slope of the drawn values over the day window (30 h), per hour — hover a cell for how well its line fits the rows behind it | threshold in — projected time until the stored value crosses a warning or critical bound, from a least-squares fit of the stored series; each cell is earliest plausible / point estimate / confidently expected using a ±2 standard-error prediction interval that widens further ahead; the last may be — within the four-window forecast horizon; '-' has its reason on hover | warn/crit — the values that breach this field to WARNING and to CRITICAL, in that order; hover either half for the range as configured | limits — the plugin's declared min/max: values outside this range are stored as UNKNOWN rather than clipped (rrdcreate's DS min/max); hover a cell for the exact bounds | state·since — the verdict at the last poll, and how long the field has been in it — hover the word for what it means; a steady OK has no transition on record and shows none | info — the plugin's description of the field, and its own note about a breach |
|---|---|---|---|---|---|---|---|---|---|---|---|---|---|---|---|
| hits ⚠ ▤ | 19.52k | 9.02k | 16.20k | 18.97k | 30.11k | 4.82k | 9.30k…21.74k | 10.13k…19.66k | +29.2% | +431.82 | - — no threshold is configured for this field | -/- | ≥ 0 | OK·- | AVC lookups resolved from the cache. |
| misses ▤ | 34.00 | 26.46 | 31.09 | 30.39 | 44.01 | 2.81 | 27.57…36.08 | 29.08…32.71 | -4.9% | +226.75m | - — no threshold is configured for this field | -/- | ≥ 0 | OK·- | AVC lookups that required a policy decision. hits + misses = total lookups. |
| allocations ▤ | 34.18 | 26.59 | 31.27 | 30.55 | 44.33 | 2.84 | 27.71…36.28 | 29.25…32.90 | -5.1% | +228.29m | - — no threshold is configured for this field | -/- | ≥ 0 | OK·- | New cache entries allocated. |
| reclaims ▤ | 33.68 | 26.33 | 30.96 | 30.25 | 43.86 | 2.78 | 27.50…35.81 | 28.96…32.58 | -4.3% | +222.95m | - — no threshold is configured for this field | -/- | ≥ 0 | OK·- | Oldest cache entries evicted and reused for new ones. |
| frees ▤ | 34.17 | 26.46 | 31.27 | 30.54 | 44.36 | 2.84 | 27.73…36.30 | 29.24…32.92 | -5.1% | +228.29m | - — no threshold is configured for this field | -/- | ≥ 0 | OK·- | Cache entries freed. |
dark mode inverts graph colours; field-table swatches, where shown, are inverted too so they match the curves