Pressure stall
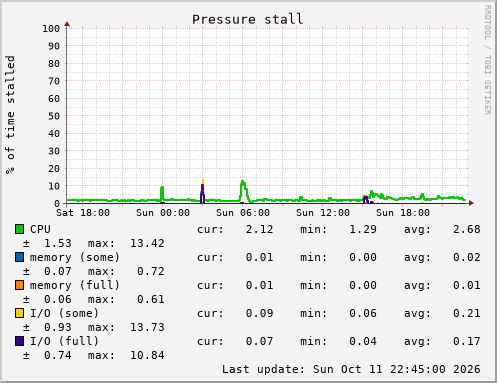
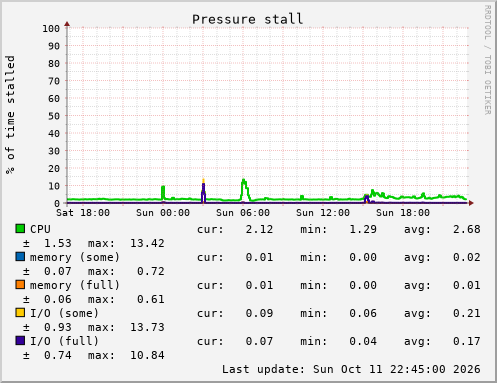
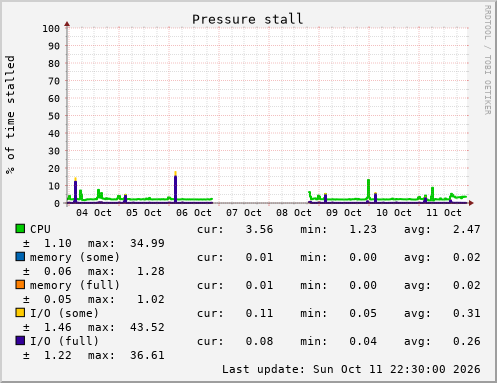
Share of wall time tasks spent stalled on a resource, derived from the cumulative total= counters in /proc/pressure. `some` means at least one task was stalled, `full` means every runnable task was. The CPU full line is omitted: the kernel documents it as meaningless at system scope.
last poll ago
 expected range
trend
expected range
trend

 expected range
trend
expected range
trend

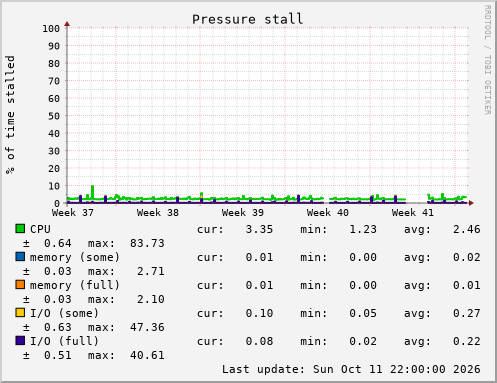 expected range — no archive holds 7200-second samples across the 5284876 seconds this window needs
trend
expected range — no archive holds 7200-second samples across the 5284876 seconds this window needs
trend

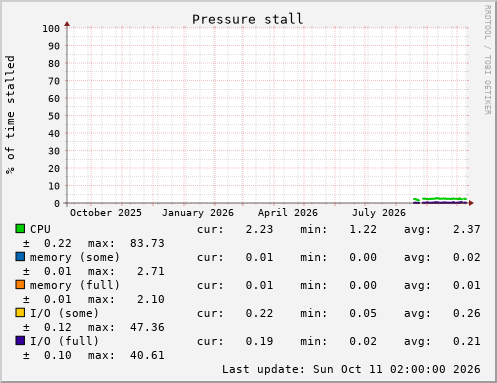 expected range — no archive holds 7200-second samples across the 36993676 seconds this window needs
trend
expected range — no archive holds 7200-second samples across the 36993676 seconds this window needs
trend
| field — the plugin's label for the field, or its name where it gave none; the swatch is the colour the graph drew it with | cur — the newest consolidated value in the day window (30 h) | min — lowest value over the day window (30 h) — where the window is served by a coarser archive this is the true minimum, read from the RRD's own MIN archive rather than taken from the averaged rows; a field with a cdef stays on those averaged rows, since the minimum of a difference is not the difference of the minima | avg — mean of the consolidated values over the day window (30 h) | med — median of the consolidated values over the day window (30 h) — always an actual sample (the upper middle on even counts, never an interpolated value); beside avg so skew is visible at a glance | max — highest value over the day window (30 h) — where the window is served by a coarser archive this is the true maximum, read from the RRD's own MAX archive rather than taken from the averaged rows, so a spike inside one consolidated bin still shows; a field with a cdef stays on those averaged rows, since the maximum of a difference is not the difference of the maxima | σ — population standard deviation of the consolidated values over the day window (30 h) — an approximation over consolidated rows on long windows, unlike min and max, which read the RRD's own MIN/MAX archives there (except on a field with a cdef) | p5…p95 — 5th and 95th percentiles (linear interpolation) of the consolidated values over the day window (30 h) — the robust floor and ceiling beside min's and max's literal ones, for the fields where one unlucky bin is not the story; sort by either half. An approximation over consolidated rows on long windows, unlike min and max, which read the RRD's own MIN/MAX archives there (except on a field with a cdef) | p25…p75 — 25th and 75th percentiles of the consolidated values over the day window (30 h) — the box around med: half the window's samples lie between them, so the spread they show is one no single excursion can move, where σ beside them is a squared distance that skew drags around | Δ — this window's average against the preceding equal window's, as a signed percentage; consolidation may differ between the two windows on fine-rung boundaries, and a cell whose two windows came back at different resolutions says so on hover; '-' when the previous window offers no baseline — hover for why | trend (per hour) — least-squares slope of the drawn values over the day window (30 h), per hour — hover a cell for how well its line fits the rows behind it | threshold in — projected time until the stored value crosses a warning or critical bound, from a least-squares fit of the stored series; each cell is earliest plausible / point estimate / confidently expected using a ±2 standard-error prediction interval that widens further ahead; the last may be — within the four-window forecast horizon; '-' has its reason on hover | warn/crit — the values that breach this field to WARNING and to CRITICAL, in that order; hover either half for the range as configured | limits — the plugin's declared min/max: values outside this range are stored as UNKNOWN rather than clipped (rrdcreate's DS min/max); hover a cell for the exact bounds | state·since — the verdict at the last poll, and how long the field has been in it — hover the word for what it means; a steady OK has no transition on record and shows none | info — the plugin's description of the field, and its own note about a breach |
|---|---|---|---|---|---|---|---|---|---|---|---|---|---|---|---|
| CPU ▤ | 3.36219 | 1.29058 | 2.63924 | 2.10231 | 13.4209 | 1.52758 | 1.59213…4.92349 | 1.99757…2.78151 | +11.6% | +0.0431351 | - — no threshold is configured for this field | -/- | ≥ 0 | OK·- | Share of time at least one task was stalled waiting for CPU. |
| memory (some) ▤ | 0.0102824 | 0 | 0.019119 | 0.00111577 | 0.718761 | 0.0669672 | 0.000000649444…0.0784771 | 0.000057705…0.0114226 | +69.2% | +0.000689618 | - — no threshold is configured for this field | -/- | ≥ 0 | OK·- | Share of time at least one task was stalled reclaiming or waiting for memory. |
| memory (full) ▤ | 0.00669724 | 0 | 0.0145215 | 0.000610172 | 0.608282 | 0.0562663 | 0.000000649444…0.0631372 | 0.0000151778…0.00775082 | +67.2% | +0.000525833 | - — no threshold is configured for this field | -/- | ≥ 0 | OK·- | Share of time every runnable task was stalled on memory at once. |
| I/O (some) ▤ | 0.100123 | 0.0571668 | 0.212962 | 0.0875444 | 13.7332 | 0.933709 | 0.0654654…0.283881 | 0.0755384…0.101185 | +1.8% | +0.00100261 | - — no threshold is configured for this field | -/- | ≥ 0 | OK·- | Share of time at least one task was stalled waiting on I/O. |
| I/O (full) ▤ | 0.0786171 | 0.0358177 | 0.171701 | 0.0736583 | 10.8447 | 0.740771 | 0.0553817…0.216893 | 0.0643293…0.0859215 | -1.5% | +0.000787194 | - — no threshold is configured for this field | -/- | ≥ 0 | OK·- | Share of time every runnable task was stalled on I/O at once. |
dark mode inverts graph colours; field-table swatches, where shown, are inverted too so they match the curves